Harlow Trap Statistics: Bias Data, Win Rates and Draw Analysis
Best Greyhound Betting Sites – Bet on Greyhounds in 2026
I spent the first three years of my form analysis career ignoring trap draws entirely. Greyhounds were athletes, I reasoned, and their raw ability would override a number stitched onto a jacket. Then I sat down with six months of Harlow data and watched that assumption collapse in front of a spreadsheet. Trap 6 at Harlow was winning at 21% — five full percentage points above the theoretical expectation for a six-runner field — and nothing in the dog’s form alone explained it. The track was doing something that form couldn’t see.
That discovery changed the way I build race assessments. At Harlow’s 334-metre circuit, the geometry of the bends, the positioning of the hare rail and the run to the first turn all conspire to give certain boxes a measurable edge over certain distances. A punter who treats every trap as equal is handicapping themselves before the lids even rise. On the other end of the scale, a punter who leans too heavily on a single stat — say, that eye-catching Trap 6 figure — without understanding why it exists will misapply the data just as badly.
This piece lays out the full trap-by-trap picture at Harlow: how the numbers are gathered, what they look like broken down by distance and race type, how they shift with the seasons and, most importantly, how to fold them into actual selections without overfitting to noise. Every percentage cited here draws on GBGB-licensed result data. The theoretical baseline is 16.67% — one winner in every six runners — and every deviation from that line is where your edge starts or ends.
See also: harlow greyhound results — everything about Harlow greyhounds.
How Trap Statistics Are Collected and Calculated
A few years back I tried pulling trap data from three different websites for the same Harlow meeting and got three different sets of numbers. The discrepancy taught me a lesson I now pass on to anyone willing to listen: where the data comes from matters as much as what it says.
GBGB — the Greyhound Board of Great Britain — records every result at every licensed stadium. That central database feeds the official results pages and, in turn, the aggregator sites that most punters use. The raw material is solid. The problems creep in when aggregators apply their own filters: some strip out void races, others exclude non-runners differently, and a handful lump trial results in with competitive meetings. If you are building your own trap bias model, the cleanest route is to work from GBGB result data directly and apply a consistent set of rules to every race you include.
The calculation itself is straightforward. For each trap number at Harlow, count the total starts over a defined period and count the wins. Divide wins by starts, multiply by 100, and you have a win percentage. The theoretical expectation in a standard six-runner field is 16.67% per trap. Any sustained deviation above or below that line signals a bias worth investigating. “Sustained” is the key word here — a sample of thirty races can throw up wild swings that mean nothing. I generally want at least 200 starts per trap before I treat a deviation as meaningful, and even then I look at confidence intervals rather than naked percentages.
One common mistake is pooling all distances together. Harlow’s 238-metre sprint and its 592-metre staying trip present entirely different challenges at the first bend, so their trap biases can point in opposite directions. I always split the data by distance before drawing any conclusions, and I recommend you do the same.
The time window matters too. I refresh my core dataset every calendar quarter, archiving the previous period so I can track trends across seasons. Going conditions, hare-rail adjustments and even changes to the sand composition can nudge the bias in one direction for months before reverting. Quarterly snapshots capture that drift without drowning in daily noise.
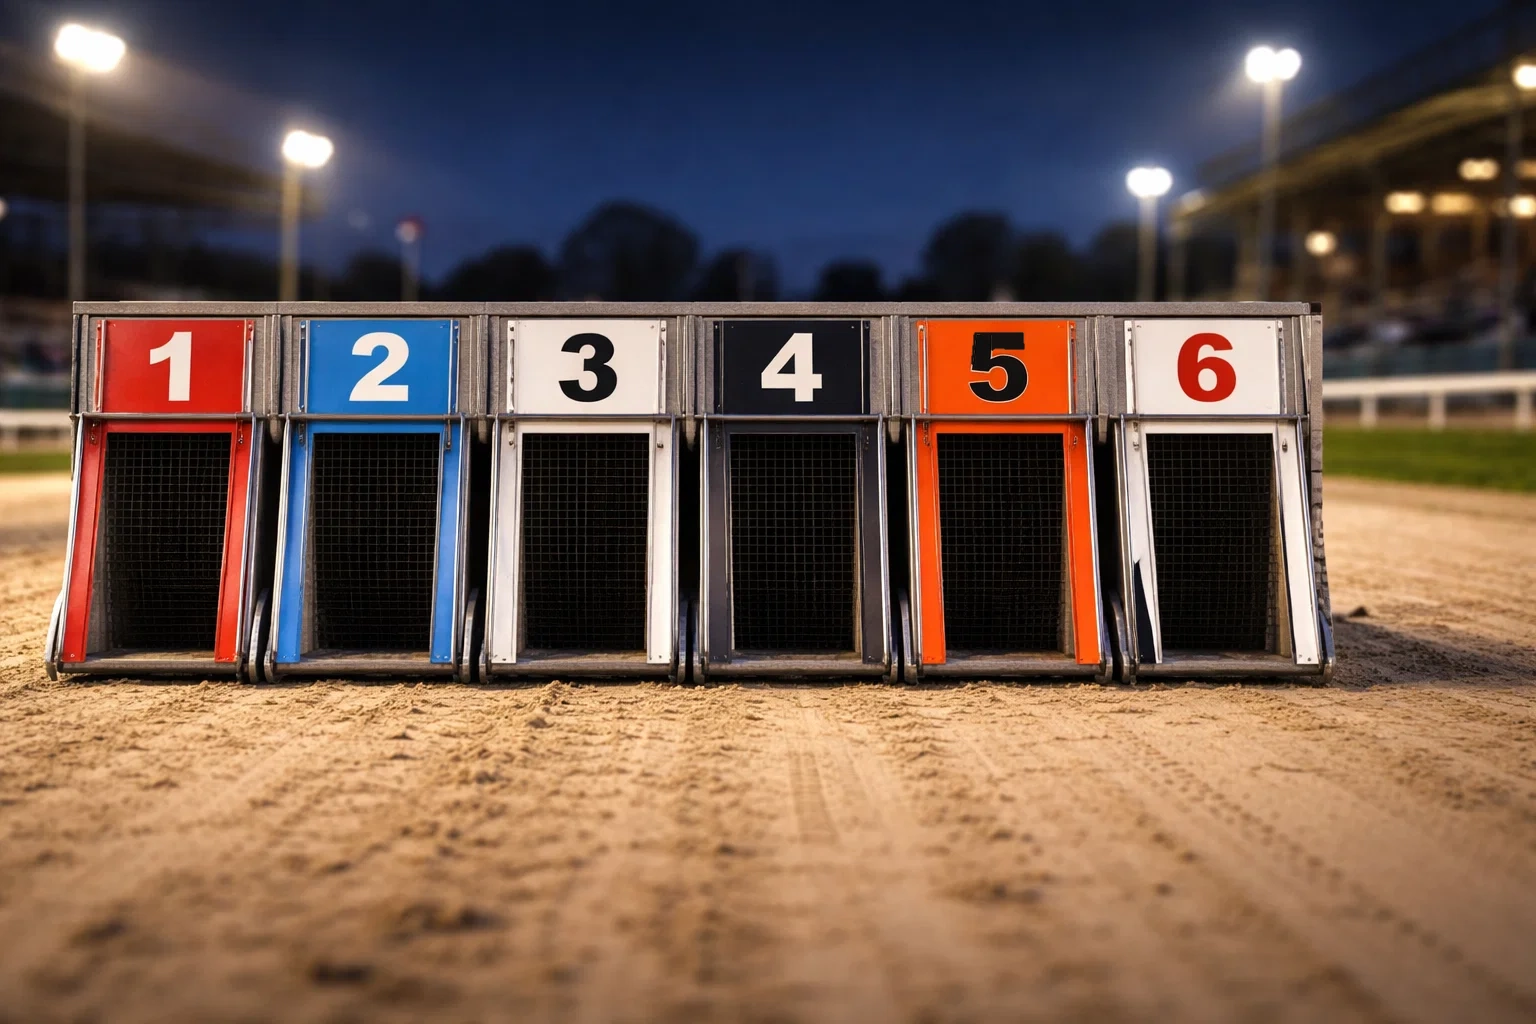
Trap-by-Trap Win Rates at Harlow
The number that stops most people mid-scroll is Trap 6. In 2025 data compiled by Greyhound Stats UK, the outside box at Harlow returned a 21% win rate — comfortably the highest for any outer trap at a GBGB-licensed track that year. To put that in perspective, the theoretical expectation for any single trap in a six-dog race is 16.67%. Five percentage points of sustained over-performance is not a quirk; it is a structural feature of the circuit.
Why does Trap 6 outperform here when the outside box is typically a graveyard at tighter tracks? Harlow’s 334-metre circumference produces relatively wide bends by modern standards. The outside runner doesn’t get squeezed into the rail the way it does at a smaller circuit like Monmore. Instead, a fast-breaking Trap 6 dog can hold a clear racing line around the first bend without interference, then drift to the rail on the back straight with momentum intact. At shorter-circumference tracks the geometry crushes that advantage before it develops.
Trap 1, as expected, sits above the theoretical line on most datasets I pull for Harlow, typically landing between 18% and 19%. The rail advantage is real but modest — nothing like the dominance you see at Romford, where Trap 1 can push towards 22%. The reason traces back to the same geometry: wider bends dilute the rail advantage because the angle of the first turn is less acute. A Trap 1 dog still saves ground, but a fast Trap 6 runner can match that saving through sheer unimpeded pace.
The middle traps — 2 through 5 — are where most of the noise lives. Trap 3 and Trap 4 at Harlow tend to hover close to 16%, sometimes dipping below. These boxes face the worst of both worlds: no rail to hug and no wide open racing line to exploit. A middle-trap dog’s fate depends almost entirely on the pace map — who breaks fast on either side — rather than on any inherent positional advantage. That’s not to say you avoid middle traps; it means you need stronger form evidence to back one.
Trap 2 tends to benefit when Trap 1 is drawn with a known slow starter. In those situations, the Trap 2 dog effectively inherits the rail advantage. I’ve seen Trap 2’s win percentage climb to 19% in subsets where the Trap 1 runner had a SAw (slow away) comment in its last two runs. Conditional bias like this is invisible if you only look at headline numbers.
Trap 5 is the mirror image of Trap 2 on the outside. When Trap 6 draws a moderate breaker, Trap 5 can sweep across and take the wider line. But when Trap 6 has a confirmed quick breaker alongside, Trap 5 gets pinched and its win rate drops below 15%. Again, the headline number masks the conditional reality underneath.
How Trap Bias Changes Across Harlow Distances
The first time I separated Harlow’s trap data by distance, the sprint numbers looked like they belonged to a different track entirely. Over the 238-metre dash, the run to the first bend is desperately short. Dogs break from the boxes and hit the turn almost immediately, which compresses the time available for a wide runner to establish position. At this trip, Trap 1 consistently outperforms its headline average, often pushing past 20%, because the rail runner barely needs to travel any lateral distance before the field funnels into the bend.
Trap 6’s celebrated 21% overall figure weakens considerably at 238 metres. The outside box still wins its share, but closer to 17% — only a whisker above expectation. The sprint just doesn’t give the wide runner enough straight-line metres to convert raw speed into a positional advantage before the first turn arrives. If you are backing a Trap 6 sprinter at Harlow, you need a dog with genuinely exceptional early pace to overcome that compression, not just a solid breaker.
The 415-metre standard trip is where the headline biases hold most firmly. This is Harlow’s bread-and-butter distance, accounting for the majority of races on any given card, and the run to the first bend is long enough for early pace to assert itself without being so long that the field strings out before the turn. Trap 1 and Trap 6 both perform above expectation here, while the middle traps remain close to theoretical. The 415-metre data is also the most statistically robust simply because of volume — more races mean more starts per trap, which tightens the confidence intervals and makes the bias signal more reliable.
Stretch out to 592 metres — the staying trip that involves two full laps of the circuit — and the picture shifts again. Over two laps, the field negotiates four bends instead of two, and the cumulative rail saving for Trap 1 compounds. Dogs drawn wide have to cover more ground in total, and the initial advantage of an unimpeded first bend is diluted by three subsequent turns where the rail dog saves progressively more ground. In my datasets, Trap 1’s win percentage at 592 metres at Harlow regularly exceeds 20%, while Trap 6 drifts back towards 17% or below.
The practical takeaway is simple. If your selection is drawn in Trap 6 and running over a sprint trip, be cautious — the geometry is working against you. At 415 metres, the outside draw is a genuine weapon. At 592 metres, give the rail an extra tick of respect in your assessment. None of this overrides form entirely, but ignoring it means leaving a quantifiable edge on the table.
Graded vs Open Races: Does Bias Shift?
Someone once told me that open races are where trap bias goes to die. I spent a month testing that claim against Harlow data and found it was half right — which, in this game, means it was entirely misleading.
Graded races at Harlow slot dogs into bands based on recent performance. The field is relatively homogeneous: six dogs of similar ability, running at similar sectional times, with similar early pace profiles. In that environment, small positional advantages compound because no single dog has the class to overcome a poor draw through raw superiority. A Trap 1 dog in a graded A3 race at Harlow doesn’t need to be faster than the Trap 6 runner — it just needs to be close enough in ability for the rail saving to tip the balance. And it usually is. Harlow’s favourite win rate in graded races sits around 36%, higher than the national average of roughly 32-35%, partly because the predictable grading structure amplifies form reliability and, by extension, the advantages baked into the draw.
Open races are a different animal. These contests bring together dogs of varying grades, sometimes from different tracks, and the ability spread in the field is wider. A genuine A1-grade dog drawn in Trap 4 at a 415-metre open race has the class to overcome middle-draw disadvantage through sheer speed. In open-race subsets at Harlow, the trap bias signal weakens — not because the track geometry changes, but because the variation in dog quality introduces more noise. Trap 1 still edges ahead of expectation, but the gap narrows to a point where I wouldn’t weight it heavily in my assessment.
Trap 6’s 21% headline is disproportionately driven by graded-race data. Strip the opens out and the figure nudges higher; include only opens and it falls closer to the baseline. That distinction matters if you are applying trap data mechanically. A system that adds two points to a Trap 6 runner in every Harlow race is over-weighting the advantage in opens and under-weighting it in graded contests.
My approach is to maintain two separate bias tables: one for graded races and one for opens. The graded table carries more weight in my selections because the sample is larger and the conditions are more controlled. The open table serves as a sanity check — if a trap shows strength in both, I treat the bias as robust. If it only shows in graded races, I treat it as conditional and look for supporting evidence in the form before committing. That question — how to turn a table of percentages into a decision on race night — is where the real work begins.
Using Trap Data in Your Selections
Data that sits in a spreadsheet doesn’t win anything. The question I get asked most is not “what are the numbers?” but “how do I actually use them on a Wednesday night card?” Here is the process I follow for every Harlow meeting, distilled into steps you can replicate without specialist software.
Start with the race card and identify the distance. Pull up the corresponding distance-specific trap bias table — not the headline figures, the split ones. Note which traps sit above the 16.67% baseline and by how much. A trap running at 19% has a mild edge. A trap at 21% has a meaningful one. A trap at 15% carries a measurable handicap. These are not certainties; they are adjustments to probability.
Next, look at each dog’s early pace profile. The in-running comments on recent form tell you whether a dog is a confirmed quick breaker (QAw, EP) or tends to be slow away (SAw). A fast breaker drawn in a high-bias trap is a compounding advantage — the draw helps and the dog’s natural style exploits that help. A slow breaker in the same trap negates much of the positional benefit because the dog won’t be in a position to use the racing line the trap offers.
Then check the neighbours. Trap bias at Harlow is not just about the box your selection occupies; it is about what is drawn alongside. A Trap 6 dog with a known slow starter in Trap 5 has a cleaner getaway than one flanked by a confirmed railer who will cut across. The pace map — which dogs want to lead, which will settle — shapes whether a theoretical bias translates into a practical one on race night.
I assign a simple three-tier rating to every runner’s trap situation: favourable, neutral or unfavourable. Favourable means the trap bias is positive for this distance and the dog’s early pace suits the draw. Neutral means the bias is marginal or the dog’s pace profile doesn’t clearly exploit or suffer from it. Unfavourable means the bias is negative and the dog’s running style compounds the problem. This rating doesn’t replace form assessment — it sits alongside it as a tiebreaker. When two dogs look level on form, the one with the favourable draw gets the nod.
One trap I see people fall into — pun unavoidable — is over-correcting. A 21% win rate for Trap 6 still means the box loses nearly four races out of five. Trap data is a filter, not a formula. It narrows the field and highlights value; it does not hand you winners on a plate. The punters who profit from trap bias are the ones who treat it as one input among several, not as a standalone system. If you want a fuller picture of how to integrate draw data with sectional times, trainer records and weight trends, the Harlow form guide walks through that layering process in detail.
Seasonal and Going-Dependent Trap Trends
Harlow’s sand track doesn’t freeze and it doesn’t waterlog, but that doesn’t mean conditions stay constant through the year. Going allowance — the adjustment applied to raw race times to account for track speed — fluctuates with moisture, temperature and maintenance cycles, and those fluctuations ripple into trap performance in ways that are easy to miss if you only look at annual averages.
Winter months at Harlow tend to produce a slower surface. Moisture retention increases, the sand compacts differently, and dogs don’t grip as firmly on the bends. In my data, the rail advantage for Trap 1 strengthens during the winter window — roughly November through February — because a slower surface rewards the shortest route even more than usual. Dogs drawn wide lose fractionally more ground per bend when the track is heavy, and over a 415-metre trip that fraction adds up to a measurable disadvantage. Trap 6’s win rate in my winter subsets drops by two to three percentage points compared to summer.
Summer brings a faster track. Drier sand means firmer footing, sharper acceleration out of the boxes and tighter sectional times. On a fast surface, raw early pace counts for more, and a Trap 6 dog with genuine speed can burn to the first bend before the field closes ranks. The outside box’s strongest quarters in my Harlow records consistently land between May and September.
There are also micro-trends tied to maintenance. Harlow’s track team re-sands and grades the surface on a regular cycle, and immediately after a fresh surface is laid the going can shift noticeably. I’ve seen bias patterns invert for a single meeting following heavy maintenance before settling back to normal by the next fixture. This is nearly impossible to model in advance, but it is worth noting if results from one meeting look wildly out of line with recent trends — check whether maintenance was scheduled before assuming your data is broken.
Rain on race day is the most visible variable. Heavy pre-meeting rain at Harlow tends to slow the going and push results towards the rail. If the forecast shows persistent rain before an evening meeting, I add a small weight to Trap 1 and Trap 2 in my assessment and reduce the weight on Trap 5 and Trap 6. It is a crude adjustment, but over hundreds of race nights it has nudged my strike rate in the right direction.
The broader lesson is that trap bias is not a fixed property of the track — it is a dynamic one. Annual figures give you the skeleton, but seasonal and going-dependent adjustments put flesh on the bones. Updating your dataset quarterly and tagging each race with the prevailing going allowance lets you spot these shifts before they become obvious to the wider market.
Frequently Asked Questions
Where the Numbers Point Next
Trap bias at Harlow is not a secret — anyone with a spreadsheet and the patience to log results can reproduce these figures. The edge lies not in knowing the numbers but in knowing when to lean on them and when to set them aside. A 21% win rate for Trap 6 is compelling, but it only becomes profitable when you pair it with the right dog, at the right distance, on the right going, against the right opponents. Strip away any one of those conditions and the number loses its teeth.
Read our Harlow greyhound form guide.
I update this data every quarter and cross-reference it against the broader patterns I track across all eighteen remaining GBGB-licensed stadiums. Mark Bird, GBGB’s chief executive, has spoken about the progress embedded in recent welfare and data initiatives across those stadiums — progress that depends, in part, on the same result datasets that form analysts like me use for entirely different purposes. The trends shift — they always do — and the punters who stay ahead are the ones who treat their bias tables as living documents rather than carved-in-stone certainties. If one thing has stayed constant across eleven years of watching greyhounds tear around Harlow, it is that the track rewards preparation and punishes assumptions. The numbers are here. What you do with them is up to you.