Harlow Greyhound Results: Track Data, Trap Stats and Form Analysis
Best Greyhound Betting Sites – Bet on Greyhounds in 2026
Track data that sharpens your edge.
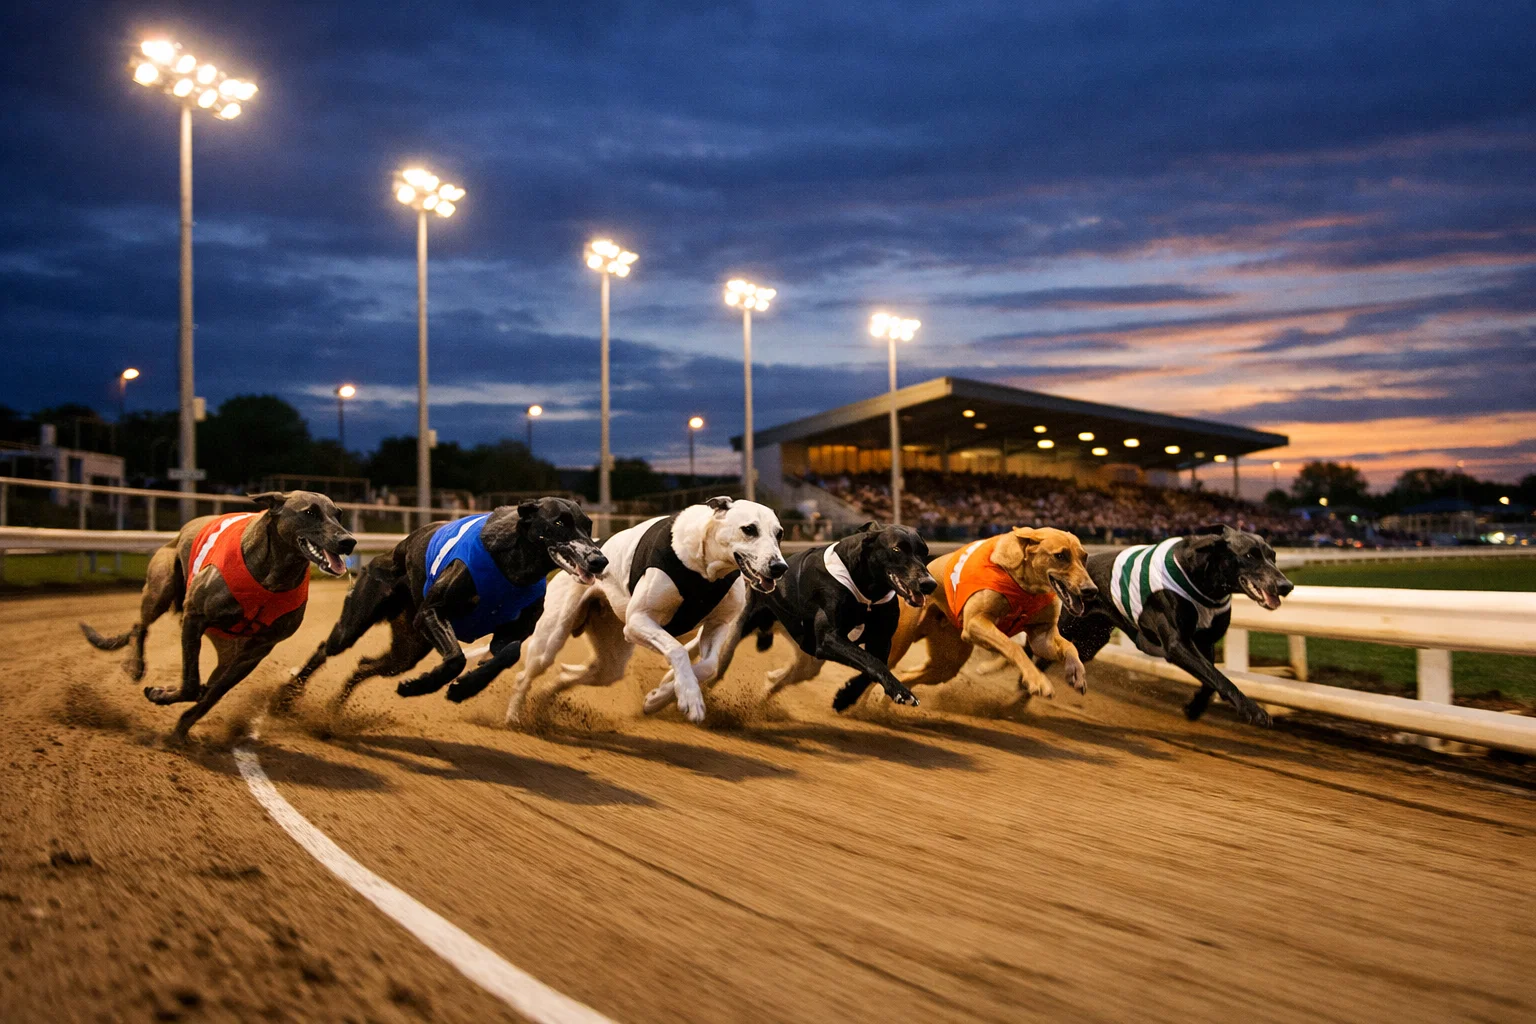
I pulled up the Harlow race card on a Wednesday evening last autumn, expecting the usual BAGS fare – tight grading, predictable pace maps, a couple of traps worth backing on the bend. What I got instead was a 14/1 winner from trap six that blew past the field before the first turn. That result did not surprise me because of the price. It surprised me because I had been tracking Harlow's outside-box data for months and knew the numbers were pointing exactly there. Most punters scrolling results on their phone never saw it coming. The data was right in front of them – they just did not know how to read it.
Harlow Greyhound Stadium has been staging races since 15 March 1995, and in those three decades it has carved out a specific identity on the British greyhound circuit. A 334-metre circumference, races across multiple distances, morning and evening fixtures on Mondays, Wednesdays and Fridays, plus Sunday morning cards – it runs more meetings than most casual followers realise. Yet the coverage Harlow receives from the major aggregators is paper-thin. You get raw results, maybe a race card, and that is it. No context about why certain traps outperform at this particular track. No guidance for someone who has just stumbled into greyhound form for the first time.
That gap is what this page fills. I have spent 11 years specialising in track-level data across GBGB-licensed stadiums, and Harlow is one of the tracks I return to most often – partly because of its quirks, partly because those quirks create genuine edges for anyone willing to look beyond the headline result. What follows is a working guide to Harlow greyhound results: the track, the data, and how all of it fits into a wider UK greyhound landscape that is changing faster than most people appreciate.
Before diving into the detail, here is a quick summary of the essentials every Harlow punter should have at their fingertips.
What You Need to Know Before the Next Harlow Meeting
- Harlow's 334-metre circuit runs three race distances (238 m, 415 m, 592 m) across Monday, Wednesday, Friday and Sunday fixtures – more meetings than most punters track.
- Trap 6 posts a 21% win rate, making the outside box the strongest draw on the track and overturning standard inside-bias assumptions.
- Favourites win roughly 36% of graded races at Harlow – above the UK average but still leaving two-thirds of races open for value.
- In-running abbreviations (SAw, EP, Crd, Bmp) reveal how a dog raced, not just where it finished – learn them and your form reading improves immediately.
- The UK industry is contracting: three tracks closed in 2025, Wales and Scotland banned racing in March 2026, and bookmaker revenue is falling in real terms.
Harlow Stadium: Track Profile and Key Numbers
The first time I drove out to Harlow, I half-expected a relic – some crumbling 1960s stadium clinging on by its fingernails. What I found was a purpose-built venue that opened in 1995, designed from the ground up for modern greyhound racing rather than retrofitted from a football ground or speedway oval. That distinction matters more than you might think, because it means the geometry of the track was planned, not inherited.
Track circumference
334 metres
Race distances
238 m, 415 m, 592 m
Capacity
1,500 spectators
Parking
400 spaces
Opened
15 March 1995
TV debut
Sky Sports, 2011
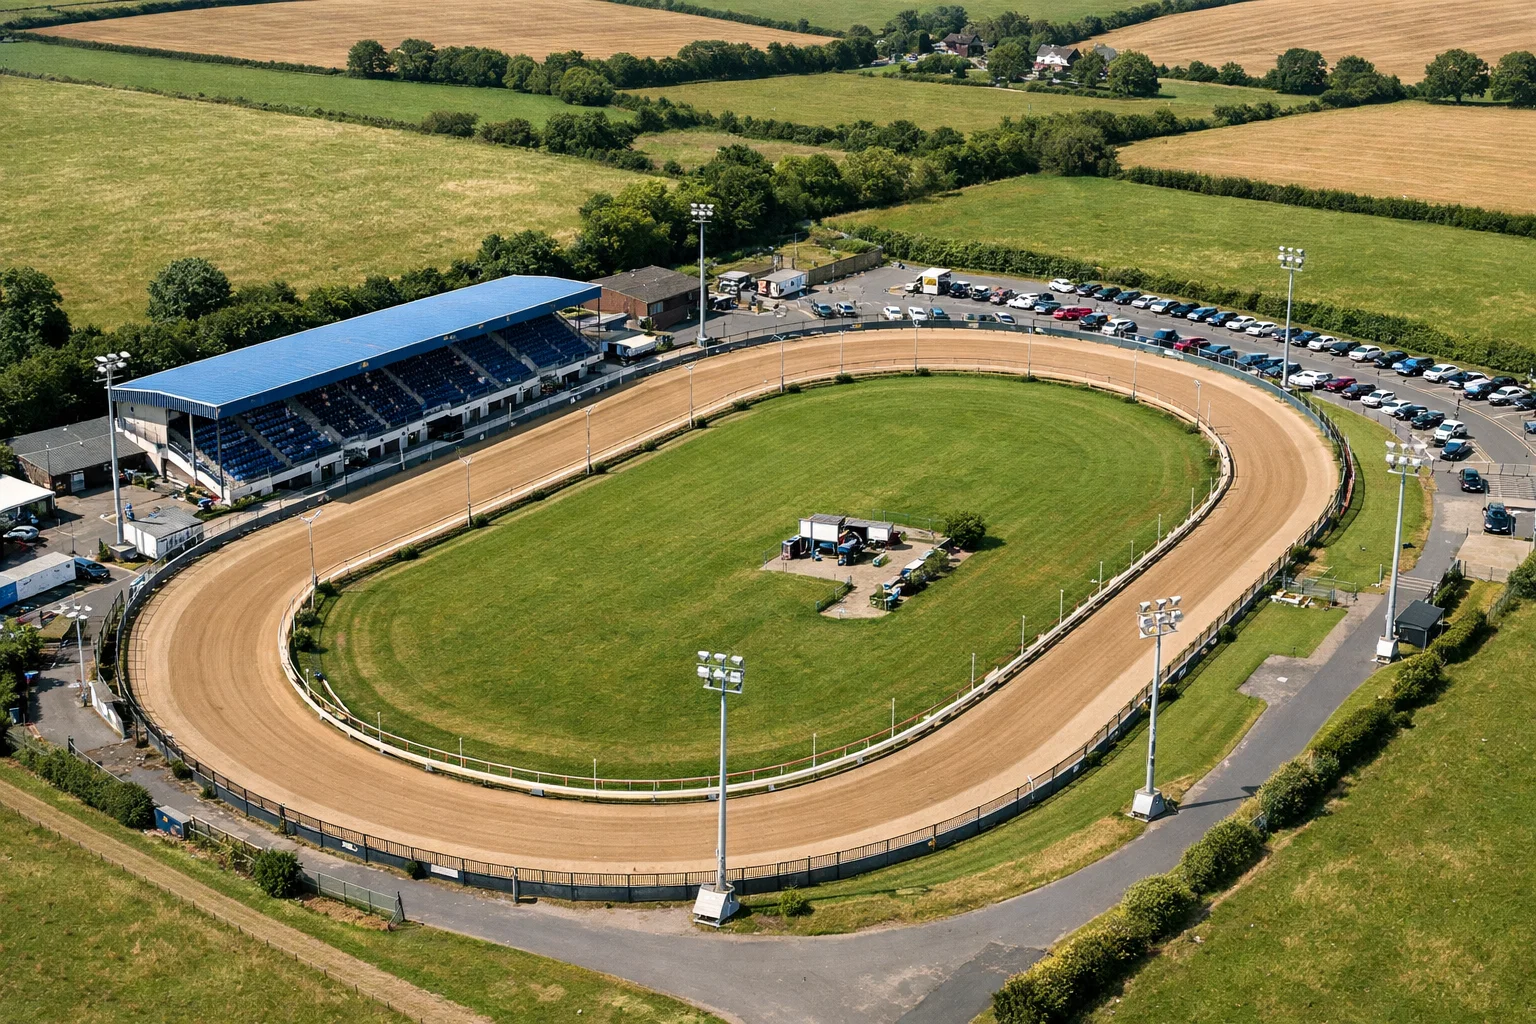
At 334 metres around, Harlow sits in the middle of the UK track-size spectrum. It is not as tight as some of the smaller circuits where inside boxes dominate every distance, and it is not as sweeping as the bigger ovals where wide runners get a fair crack. That middle ground creates its own patterns – patterns I will come back to when we look at trap bias.
The stadium itself holds 1,500 spectators and has parking for around 400 cars, which tells you something about the scale of the operation. This is not a Premier League greyhound venue pulling in weekend crowds from across the country. It is a working BAGS track – the Bookmakers' Afternoon Greyhound Service – that earns its keep by providing a steady stream of betting-shop content. Morning meetings, evening meetings, three days a week plus Sundays. The dogs race, the data flows to SIS and into betting shops, and the cycle repeats.
Harlow races on Mondays, Wednesdays and Fridays with both morning and evening fixtures, plus Sunday mornings. The exact race times shift seasonally, but the day pattern has been consistent for years. For the current week's fixtures and first-race times, the Harlow race schedule page covers it in full.
Three race distances are available: 238 metres for sprinters, 415 metres as the standard trip, and 592 metres for stayers who go round twice. The 415 m distance dominates the card on any given meeting – it is the bread-and-butter trip where most graded races are run. Sprints and stayer events get slotted in, usually one or two per card, but they carry their own distinct form profiles and trap biases.
Harlow's television journey started relatively late – no Sky Sports coverage until 2011, meaning it spent its first 16 years as a results-only track for the betting public. Today SIS coverage means every BAGS meeting is streamed to bookmaker platforms nationwide.
One piece of Harlow history that surprises people: in 2009, trainer Mark Wallis sent Kinda Ready to victory in the English Greyhound Derby while based at Harlow. A track this size producing a Derby winner says something about the quality of dogs and handlers that pass through its kennels.
What matters for results analysis is the combination of these factors – a medium-sized circuit, three distances, a high volume of BAGS meetings, and a grading system that recycles dogs through the card every week.
Understanding the mechanism starts with knowing how Harlow results are actually structured – the columns, codes and numbers that most result pages throw at you without a word of explanation.
How Harlow Greyhound Results Are Structured
A friend of mine – decent horse racing punter, sharp with numbers – tried greyhound betting for the first time last year. He pulled up a Harlow result and texted me: "What language is this?" I get it. A greyhound result line packs an absurd amount of information into a tiny space, and none of it is self-explanatory unless someone walks you through it once.
Every Harlow result follows the same skeleton: race number, distance, grade, the finishing order of all six dogs, trap numbers, dog names, trainers, in-running comments, finishing times and starting prices. Layered on top are sectional positions, distances between finishers, and calculated times adjusted for the going. Once you understand the building blocks, the whole thing becomes readable in seconds.
The in-running comments are where most newcomers hit a wall. These are shorthand descriptions of what each dog did during the race, written in a compressed code that greyhound racing has used for decades. Here are the ones you will see most often at Harlow:
SAw – Slow away. The dog was slow out of the trap at the start.
EP – Early pace. The dog showed speed in the opening metres and reached the first bend near the front.
Crd – Crowded. The dog was squeezed or impeded by runners around it, losing ground through no fault of its own.
Bmp – Bumped. Contact with another runner during the race, typically at a bend.
RIs – Ran on inner/stayed on inside. The dog raced on the rail throughout.
Led – Led. The dog was in front at the point described, often qualified by position: "Led 1" means led from the first bend.
These comments are not decorative. They are the single most useful piece of data in a result because they tell you how a dog ran, not just where it finished. A dog that finishes fourth but was "Crd&Bmp 1" – crowded and bumped at the first bend – ran a completely different race from a dog that finished fourth and "EvCh" (every chance, meaning it had a clear run and just was not fast enough). For a full A-Z breakdown, I have put together a dedicated greyhound race abbreviations reference.
Result abbreviations are standardised across all GBGB-licensed tracks, so once you learn them for Harlow, they work at Romford, Towcester, Nottingham – everywhere. The difference is how you interpret them in the context of each track's specific geometry and trap bias.
After the comments, you get the finishing time – the raw clock time from trap rise to the line. This is useful but incomplete. Track conditions change between meetings: rain, temperature, surface density all affect the going. A dog running 26.14 seconds over 415 m on a fast track is not the same as one running 26.14 on a heavy night. That is why calculated time exists – an adjusted figure that accounts for the going allowance, giving you a standardised comparison point. The calculated time guide on this site breaks down the full mechanics.
The starting price rounds out the result. For BAGS meetings like Harlow's, the SP is derived from the odds available on-course and through the ring. Comparing the SP to the finishing position over time is one of the simplest ways to identify dogs that the market consistently misprices – a habit I have found more profitable at Harlow than at many bigger tracks, precisely because the market pays less attention to it.
Decoding a Harlow Race Card in 60 Seconds
Results tell you what happened. The race card tells you what is about to happen – or at least gives you the raw material to form an opinion. I have seen people spend 20 minutes poring over a single race card and others glance at it for 10 seconds before placing a bet. Neither extreme is ideal. With practice, you can extract everything you need from a Harlow card in about a minute.
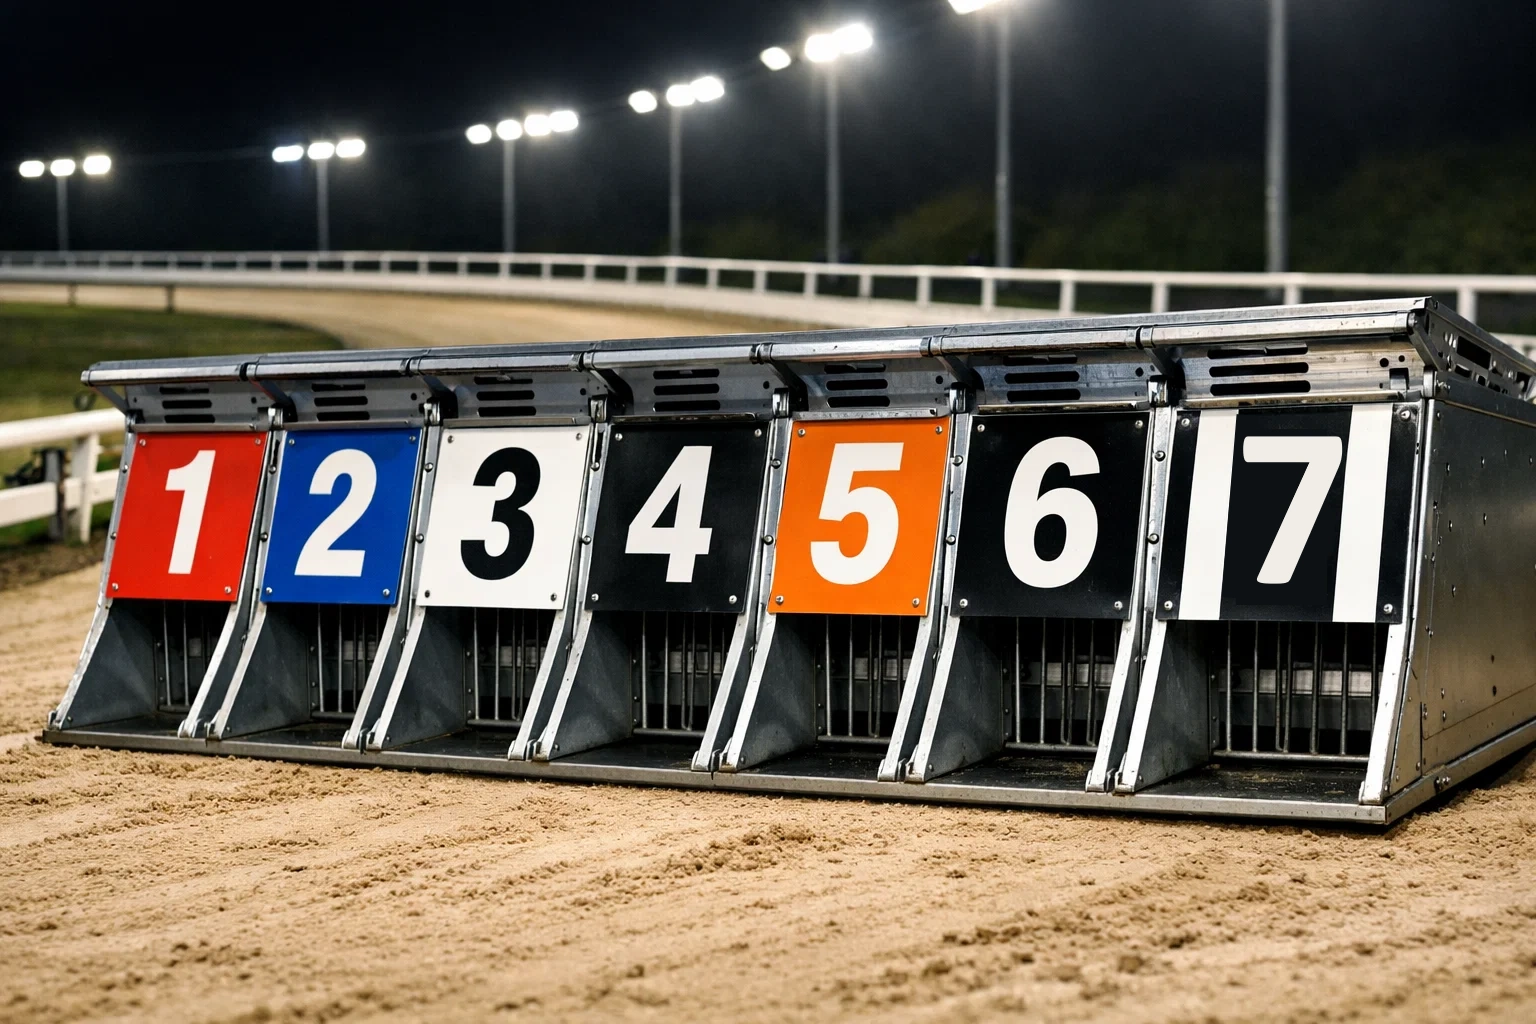
Trap number and colour
1 (red), 2 (blue), 3 (white), 4 (black), 5 (orange), 6 (striped)
Dog name and trainer
Identifies who is responsible for the dog's condition and kennel form
Form figures
Last six runs, reading left to right from oldest to most recent
Best recent time
Fastest calculated time over the card distance in recent runs
Weight
Current race-day weight in kilograms
Grade/class
The level at which this race is graded (A1 to A11, or Open)
The form figures are the first thing my eye goes to. A sequence like "111243" reads as: first, first, first, second, fourth, third – with the most recent run on the right. But raw positions only scratch the surface. You need to cross-reference them with the trap drawn that night, the distance, and the in-running comments from each of those runs. A "4" from trap six on a night where the dog was "Crd 1,SAw" is worth far more than a "1" from trap one where it "Led Al" (led all the way) against weak opposition in a low grade.
Do not read form figures in isolation. A string of "1s" can mean a dog is flying – or it can mean it has been winning in a low grade and is about to step up into stiffer company where the same performance earns a fourth. Always check whether the grade has changed between the most recent run and tonight's race.
Weight is another column that gets overlooked. Greyhounds typically race between 26 kg and 36 kg, and a shift of even half a kilogram can signal a change in condition. At Harlow, where dogs can race twice a week during busy spells, weight trends are particularly revealing.
The full column-by-column walkthrough sits in the race card guide, including common beginner mistakes. The key point: the card is not a list of runners – it is a compressed data set where every column interacts with every other column.
Trap Bias at Harlow: Which Box Wins Most?
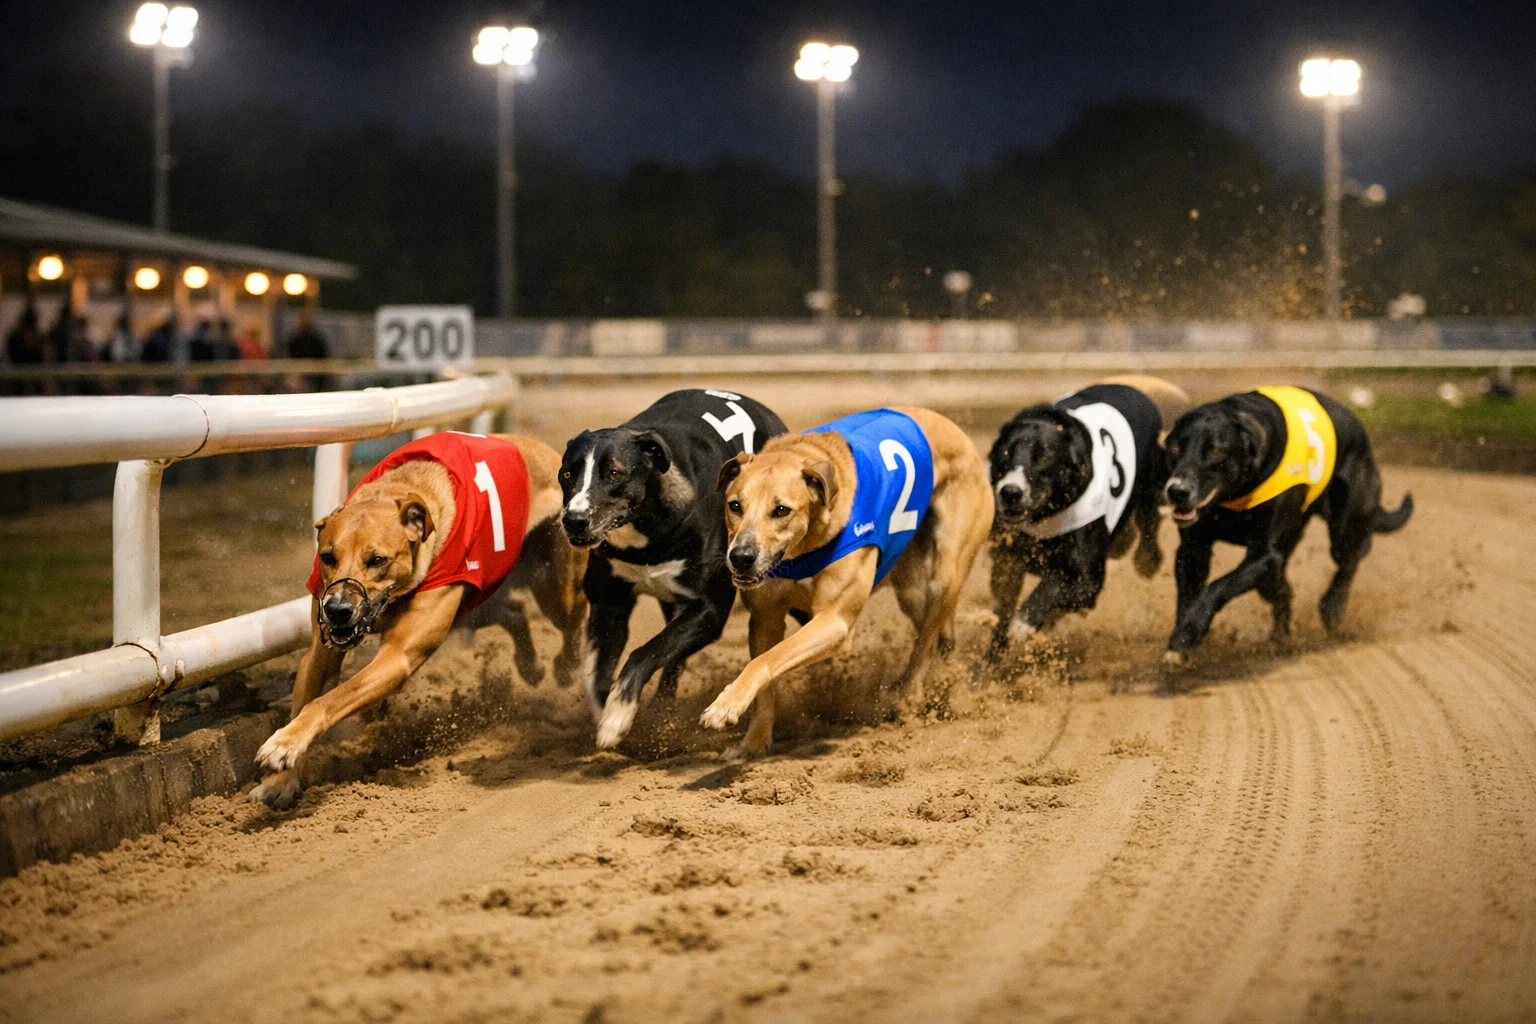
If you only take one thing from this entire page, make it this: the trap your dog starts from at Harlow is not a neutral factor. It actively shapes the outcome, and the data proves it.
In a six-runner greyhound race, pure mathematics gives each trap a 16.67% chance of winning. If the trap draw were irrelevant, every box would hover around that figure over a large enough sample. They do not. Across most UK tracks, trap one – the inside rail – tends to outperform at roughly 18-19%, because the shortest route to the first bend gives the inside dog a geometry advantage. That pattern holds at Harlow for the standard 415 m trip. But it is not the most interesting finding.
Trap 1
Above average – benefits from rail position into the first bend
Trap 2
Slightly above average – sheltered draw, often gets cover early
Trap 3
Close to theoretical 16.67% – neutral draw at most distances
Trap 4
Close to average – can go either way depending on early pace
Trap 5
Slightly below average – wide enough to lose ground, not wide enough to clear traffic
Trap 6
21% win rate – the standout performer at Harlow
That trap six figure is the headline. A 21% win rate for the widest box is one of the highest outside-trap win rates of any GBGB-licensed stadium. On most tracks, trap six is a disadvantage because the dog covers more ground to reach the rail. At Harlow, the combination of bend geometry and run to the first turn allows trap six runners to hold their line, avoid the crowding that chews up the middle traps, and arrive at the first bend with clear air.
Trap 6 at Harlow posted a 21% win rate in 2025 – making it statistically the best draw on the track, not the worst. That overturns the conventional wisdom that outside boxes are a handicap in British greyhound racing.
I have been tracking this pattern for several years, and it holds across different seasons and going conditions. The 334-metre circumference creates bends with a slightly wider radius than tighter tracks, and that extra room rewards runners who break cleanly from the outside. If you are betting at Harlow and ignoring trap six, you are leaving value on the table.
Trap bias is not static across all distances. The 238 m sprint starts on a different part of the track, meaning a shorter run-in to the first bend that compresses the field and amplifies the inside advantage. Over 592 m, where dogs go round twice, the first-bend bias gets diluted by stamina demands. The distance-specific trap data is broken down in the Harlow trap statistics analysis.
For practical purposes, the takeaway is simple: factor the trap into your assessment of every Harlow race. A strong dog drawn in trap five at 415 m faces a genuinely tougher assignment than the same dog drawn in trap six. The market does not always adjust for this – which is exactly where edges appear.
Trap draw interacts directly with distance, so understanding the three trips available at Harlow is the next piece of the puzzle.
Harlow Race Distances: 238 m to 592 m
Three numbers define the racing at Harlow: 238, 415 and 592. Every race on every card falls into one of those distances, and each one asks a fundamentally different question of the dogs running it.
| Distance | Type | Bends | Key factor |
|---|---|---|---|
| 238 m | Sprint | 2 | Trap speed and early pace – the race is often decided before the second bend |
| 415 m | Standard | 4 | All-round ability – pace, bend skill and enough stamina to maintain effort |
| 592 m | Stayer | 6 | Stamina and tactical pace – dogs that go too hard early fade in the final straight |
The 238 m sprint is pure acceleration. Dogs break from the traps and hit the first bend almost immediately, which means trap draw and box speed are disproportionately important. A slow-away dog from trap three at 238 m is in serious trouble before the race has really begun, because there is simply no distance left to recover. I find sprint results at Harlow the hardest to predict using form alone – the margin for error is so thin that a slightly slower exit can turn a potential winner into a fourth-place finisher.
Harlow's 334-metre circumference means the 238 m sprint covers just under three-quarters of a lap. The start position for sprints is further around the track than for 415 m races, which changes the geometry of the first bend and therefore the trap bias profile. Do not assume that trap data from 415 m applies to sprints.
At 415 m, Harlow stages the bulk of its graded programme. This is the distance where form figures are most reliable, because dogs are tested across enough ground to separate ability from luck. Four bends mean four opportunities for crowding and positional changes, so the in-running comments become critical reading. A dog with "EP,Led 1-3,Crd 4" tells a different story from one with "SAw,MsdBrk". Both might finish third, but only one was actually the best dog in the race.
The 592 m trip goes round twice – six bends in total. Stayer races at Harlow tend to produce bigger-priced winners because the extra distance introduces more variables: pace collapse, traffic problems on the second circuit, and dogs that stay on strongly when others tire. If you enjoy forecast and tricast betting, the 592 m distance is where the dividends tend to be fattest.
Quick Form Figures Cheat Sheet
I once watched a bloke in a betting shop stare at a Harlow race card, point at the dog with the most "1s" in its form, and back it at 4/6. It won. He thought he had cracked it. The next five bets using the same method all lost. Form figures reward careful reading, not pattern-matching.
Here is what to look for without getting bogged down – think of this as the quick-reference version before you dig into the full race card guide. For the deeper analytical approach to form, including sectional times, trainer records and going data, the Harlow form guide takes it further.
Calculated time – The finishing time adjusted for the going allowance. This is the number you compare between dogs, not the raw time. A calculated time of 26.05 over 415 m at Harlow is strong; 26.50 is moderate.
Going allowance – A correction factor applied to raw times to account for track conditions. Positive means the track is running slow (times are adjusted down); negative means it is running fast. The allowance is set by the racing manager and applies to all races on that card.
Weight – Recorded in kilograms at kennelling. Compare a dog's current weight to its weight at its best recent run. A shift of more than 0.5 kg in either direction is worth noting.
Reading a form line – example
Form: 3 1 1 4 2 1 (reading left to right, oldest to most recent). Best calculated time: 26.08. Current weight: 30.2 kg. Last run weight: 30.5 kg. The most recent run is the "1" on the far right – a win. Weight has dropped by 0.3 kg. Calculated time suggests this dog is competitive at A3 grade or above over 415 m. The "4" in the middle of the sequence came from a run where the dog was "Crd&Bmp 1" – crowded and bumped at the first bend. Dismiss it.
The biggest mistake newcomers make is treating all finishing positions as equal. A "3" earned while crowded at two bends is a better run than a "2" in a slow race against weak opposition. Always read the comments before drawing conclusions from the numbers.
How Grading Works at Harlow
Every Monday morning, a racing manager sits down with the previous week's results and reshuffles dogs between grades. Win a race, move up. Lose badly, move down. It sounds straightforward until you realise that the grading system is the invisible engine that shapes every single Harlow race card – and understanding it changes how you read results entirely.
Harlow uses the standard GBGB grading ladder. Dogs are classified from A1 (the highest at this track) through to the lower tiers, based on recent race times and finishing positions. The grading window assesses a dog's last few runs at the relevant distance and assigns it to a band where it should be competitive against dogs of similar ability.
Grading at Harlow resets when a dog switches distance. A dog graded A3 over 415 m might be regraded when entered for a 238 m sprint, because its sprint times could place it in a different band. Keep an eye on dogs making a distance switch – the grade they land in might not reflect their true ability at the new trip.
| Race type | How dogs qualify | Form reliability |
|---|---|---|
| Graded | Assigned by the racing manager based on recent times and form | High – dogs are matched by ability, so form figures are directly comparable |
| Open | Entered by trainers, no grade restriction | Lower – mixed-ability fields mean form from graded races may not translate |
The distinction between graded and open races is critical for form analysis. In a graded race, every dog should be broadly similar in ability, so form figures from recent graded runs are directly comparable. In an open race, a dog dropping from A1 might face one climbing from A5 – the form figures come from different competitive contexts, and comparing them at face value is a trap.
Harlow's card typically mixes both types. Most races on a standard BAGS meeting are graded, with the occasional open event slotted in for dogs that do not fit neatly into the grading bands. The practical rule: always check the grade before assessing a performance. A time of 26.20 in an A2 is a better run than 26.10 in an A6.
Betting on Harlow: Odds, Markets and Value Signals
Here is something that took me years to properly internalise: the best dog does not always win, but the best value bet always has an edge over time. At Harlow, where the favourite wins roughly 36% of graded races – above the UK national average of around 32-35% – the market gets it right more often than at many tracks. That sounds like bad news for anyone looking to beat the odds. It is actually the opposite, because it means the other 64% of the time, the favourite loses, and the market's confidence in those favourites compresses the odds on the remaining runners, creating pockets of value that careful analysis can exploit.
Betting markets for Harlow BAGS meetings are generated primarily for the betting-shop audience. Odds are set by bookmakers' trading teams, often using automated models that weight recent form, trap draw and grade. The starting price – the final odds at the off – is the benchmark against which all results are settled unless you take an early price. For Harlow, comparing early prices to SP across a season reveals a consistent pattern: the market tends to slightly over-bet favourites in low-grade races and under-bet them in higher grades, where the form is more reliable and upsets are rarer.
Forecast bet – example calculation
Suppose you believe dog A will finish first and dog B will finish second in a Harlow 415 m race. A straight forecast requires both predictions to be correct in that exact order. If dog A wins at 3/1 and dog B finishes second, the forecast return is calculated by the computer straight forecast (CSF) – a formula based on the SPs of all runners. Typical CSF returns at Harlow for a 3/1 winner with a 5/1 second range from around 20/1 to 35/1, depending on the competitiveness of the field. A reverse forecast covers both possible orders (A first, B second OR B first, A second) but costs twice the stake.
Forecast and tricast bets are where Harlow becomes genuinely interesting from a value perspective. Six-runner fields mean 30 possible straight forecast combinations and 120 tricasts. That sounds like a lottery, but trap bias, form and grading narrow the realistic outcomes dramatically. A forecast combining two identified dogs backed by data is a structured bet, not a random punt.
Responsible gambling matters. Greyhound racing runs at a fast tempo – a meeting can have 12 races in under two hours. The speed creates a temptation to chase losses or escalate stakes between races. Set a budget for the meeting before the first race and stick to it. If you need support, GamCare and the National Gambling Helpline are available 24 hours.
Three markets dominate Harlow betting: win, each-way (your dog finishes first or second at reduced odds) and forecast/tricast (predict the first two or three in exact order). In a low-grade race where form is unreliable, a forecast spreads risk across multiple outcomes. In a strong graded race with a clear form standout, a win bet at a fair price might be smarter.
One angle I use regularly at Harlow: comparing the implied probability of the favourite with its actual strike rate. A dog priced at 4/5 implies a 55.6% win probability, but Harlow favourites in graded races win around 36% of the time. That gap means you are paying a premium the data does not support. Over 100 bets, the premium adds up. I go deeper into odds analysis and staking in the Harlow betting odds breakdown.
The economics of betting connect directly to the economics of the sport itself – and the wider UK greyhound industry is navigating pressures that every Harlow punter should understand.
The Bigger Picture: UK Greyhound Racing in 2026
When I started analysing greyhound data 11 years ago, there were more tracks, more dogs and more certainty about the sport's future. Today, the landscape looks different in almost every direction, and if you follow Harlow results without understanding this context, you are missing forces that directly affect the quality of racing and the long-term viability of the stadium.
The UK currently has 18 GBGB-licensed greyhound stadiums. At the peak in the 1940s, there were 77. That decline has accelerated sharply: in 2025 alone, three tracks closed – Crayford in January, Perry Barr in August and Swindon in December. A new venue, Dunstall Park, opened in September 2025 as a partial replacement for Perry Barr, but the net direction is clear. The circuit is shrinking.
Every track closure concentrates more dogs and more racing activity onto fewer venues. For Harlow, fewer competitors in the south-east means a potentially larger pool of dogs available for grading – but it also means the sport's footprint contracts, public visibility fades and political pressure grows.
That political pressure arrived with force in March 2026. On 17 March, the Senedd voted 39 to 10 to ban greyhound racing in Wales. The following day, the Scottish Parliament voted 70 to 27 for its own prohibition bill, carrying penalties of up to five years in prison and fines of up to 20,000 pounds. Mark Ruskell, the Green MSP behind the Scottish bill, called the case against greyhound racing "unstoppable". GBGB chief executive Mark Bird countered that the Welsh government had rejected a regulated industry providing "far greater protections for its racing greyhounds than for any domestic pet dog".
Neither Wales nor Scotland hosted GBGB-licensed tracks at the time, so the immediate operational impact on Harlow is zero. But the precedent is set: two of the UK's four nations have legislated against the sport. Whether England follows is a political question, not a certainty, but the momentum is visible.
At its 1940s peak, UK greyhound racing attracted more than 75 million spectators annually – rivalling football. Today the sport operates from 18 tracks, a fraction of its former scale.

The financial picture adds another layer. GBGB's commercial director Mark Moisley has been blunt: bookmaker income is declining year on year, and at the current rate, the industry faces serious trouble. Betting-shop turnover on greyhound racing reached 794 million pounds in the financial year ending March 2024, but real-terms turnover has fallen by 23% over three years. The Remote Gaming Duty is rising from 21% to 40%, squeezing the bookmakers who fund BAGS meetings – the same meetings that keep Harlow's lights on.
GBGB tracks survive on a combination of the BGRF levy – 0.6% of bookmaker turnover on greyhounds, generating 6.75 million pounds in 2024-25 – and commercial income from hosting meetings. When that levy income shrinks, tracks face a choice between cutting costs, reducing fixtures or closing. Harlow's lean operating model has insulated it so far, but the margin gets thinner each year.
Despite all of this, the injury data tells a more positive story than the headlines suggest, and it is worth understanding those numbers before forming a view on the sport's welfare record.
Welfare Standards at GBGB-Licensed Tracks
I will be direct about this: you cannot follow greyhound racing seriously without engaging with the welfare debate. Ignoring it does not make it go away, and the numbers deserve honest examination rather than either blanket dismissal or uncritical acceptance.
GBGB publishes annual injury and retirement data for all its licensed tracks, and the 2024 figures show a clear trend of improvement. From 355,682 individual race starts across GBGB stadiums, 3,809 injuries were recorded – an injury rate of 1.07%, the lowest on record. The rate of fatal incidents on track has halved from 0.06% in 2020 to 0.03% in 2024, representing 123 cases. Those are 123 too many for anyone who cares about the dogs, but the direction of travel is downward, and substantially so.
The most common injury category at GBGB tracks in 2024 was muscular injuries to the hind limbs, accounting for 1,013 cases at a rate of 0.28%. Hock injuries followed at 718 cases (0.20%). Understanding the injury profile matters because it drives the veterinary protocols and track-surface standards that GBGB imposes on venues like Harlow.
The retirement and rehoming numbers have shifted even more dramatically. In 2024, 94% of greyhounds leaving racing were successfully rehomed – up from 88% in 2018. Economic euthanasia has dropped by 98%, from 175 dogs in 2018 to 3 in 2024. Mark Bird called that reduction a point of particular pride, stating that the board has been "clear that putting a greyhound to sleep for economic reasons is unacceptable".
Real money has followed. The Injury Retirement Scheme has paid out nearly 1.5 million pounds since December 2018, and the Greyhound Retirement Scheme has channelled more than 5.6 million pounds to homing centres since 2020. Adoptions from GRS-affiliated shelters rose by 37% in the first half of 2025.
GBGB welfare metrics have improved across every major measure since 2018: injuries down, fatalities halved, rehoming rate at 94%, economic euthanasia virtually eliminated. The trajectory is positive, though critics argue the figures still represent thousands of injuries per year and that the sport's fundamental structure exposes dogs to avoidable risk.
These are industry-wide numbers, not Harlow-specific breakdowns. GBGB does not publish track-level welfare data in its public reports, which is a limitation. Whether Harlow's injury rate sits above or below the 1.07% national average is not something I can verify from published sources, and any track that genuinely leads on welfare should have nothing to fear from transparency on this point. What I can say is how Harlow stacks up against its neighbours on the metrics I do have access to – the racing data.
Harlow Compared With Other Essex and London Tracks
People regularly ask me: "Should I follow Harlow or Romford?" It is a fair question if you live in Essex or east London and want to concentrate your form study on one track. My answer depends on what you are looking for.
Romford is the higher-profile venue – bigger crowds, stronger grading, more open races and deeper markets. It attracts trainers who want competitive opportunities for their better dogs. If you are drawn to top-grade racing and a busy stadium atmosphere, Romford is the obvious pick.
Harlow offers something different: volume, regularity and exploitable patterns. The BAGS schedule delivers multiple meetings per week, the grading recycles dogs frequently, and the smaller profile means less market attention. Less attention means more opportunities for anyone doing their own analysis.
| Factor | Harlow | Romford |
|---|---|---|
| Circuit | 334 m | 375 m |
| Meeting frequency | Mon/Wed/Fri + Sun AM | Multiple days including Saturday night |
| Typical grade depth | Mid-range BAGS grading | Higher-grade racing with more open events |
| Market attention | Lower – less liquidity, wider spreads | Higher – tighter odds, more competitive market |
| Trap 6 win rate | 21% (standout) | Closer to theoretical average |
Then there is the ghost in the room: Crayford. Until January 2025, Crayford was the third major south-east track. Its closure by Entain left a gap that has not been fully absorbed. Some Crayford trainers redistributed dogs to Harlow and Romford, slightly increasing dog availability and potentially improving the quality of graded fields.
For anyone focused on the south-east, my recommendation is to study both Harlow and Romford but treat them as separate data sets. Form earned at one track does not transfer cleanly to the other because the circuit sizes, bend profiles and trap biases are different. A dog that thrives from trap six at Harlow may find the wider Romford track neutralises that advantage entirely.
With the track, the results structure, the data and the wider context all covered, here are the questions I get asked most often about Harlow greyhound racing.
Frequently Asked Questions
What days does Harlow Greyhound Stadium race?
Harlow stages fixtures on Mondays, Wednesdays and Fridays, with both morning and evening meetings on each of those days, plus Sunday mornings. The exact first-race times vary seasonally, but the day pattern is consistent throughout the year. Check the official Harlow fixture list or the GBGB website for specific race times on any given week.
What distances are available at Harlow greyhound track?
Three distances: 238 metres (sprint), 415 metres (standard) and 592 metres (stayers). The 415 m trip dominates the card, with sprints and stayer races typically filling one or two slots per meeting. Each distance has its own trap bias profile and form characteristics, so treat them as separate data sets when analysing results.
Which trap wins most often at Harlow?
Trap 6 – the outside box – posted a 21% win rate at Harlow in 2025, making it the strongest draw on the track. This is unusual because on most UK circuits, inside traps outperform. The 334-metre circumference at Harlow creates bend geometry that allows wide runners to maintain position rather than losing ground, particularly over the 415 m standard distance.
Where can I watch Harlow greyhound races live?
All Harlow BAGS meetings are covered by SIS (Satellite Information Services), which provides live streams to licensed bookmaker platforms. Most major online bookmakers offer free streaming of greyhound racing to customers with a funded account or a recent bet. Harlow has also been broadcast on Sky Sports since 2011, though not every meeting receives Sky coverage.
What do greyhound race abbreviations mean?
In-running comments use standardised abbreviations: SAw (slow away), EP (early pace), Crd (crowded), Bmp (bumped), Led (led), RIs (ran on inner/stayed inside), EvCh (every chance) and many more. These describe what happened during the race and are crucial for judging whether a finishing position reflects true ability. A full reference list is available in the abbreviations guide on this site.
How does the grading system work at Harlow?
Harlow uses the GBGB grading system, where dogs are assigned grades (A1 being the highest at this track) based on recent race times and finishing positions. The racing manager reviews results after each meeting and adjusts grades – winners move up, poor performers move down. Grading resets when a dog switches distance. Open races sit outside the structure entirely, allowing entries from any grade.
Is greyhound racing being banned in England?
As of spring 2026, greyhound racing has been banned in Wales and Scotland but remains legal in England. The Welsh Senedd voted 39-10 and the Scottish Parliament voted 70-27 for their respective bans in March 2026. No equivalent legislation has been introduced at Westminster. The situation could evolve, but there is currently no active legislative process targeting English greyhound racing.
What Harlow's Data Tells the Patient Punter
Every Harlow result is a data point, and data points become useful when you know what to do with them. The trap six anomaly, the favourite strike rate, the way grading recycles dogs through the card – none of this is hidden. It is all sitting in the public results, waiting for someone to read it with context rather than skimming the finishing positions.
I keep coming back to Harlow because it rewards careful analysis. The market is thinner, the patterns are persistent, and the competition for information edges is lighter. Whether you are checking last night's results or building a long-term picture of track behaviour across seasons, the approach is the same: look at the data, understand the structure, trust the numbers over gut feel.
Harlow greyhound results become genuinely useful when you combine three layers: the raw result (what happened), the structural context (trap draw, grade, distance, going) and the trend data (how dogs, traps and trainers perform over time at this specific track). Strip away any one of those layers and you are guessing. Keep all three in play and the guessing starts to look a lot more like informed analysis.
The track is not going anywhere. While the industry contracts around it, Harlow's BAGS schedule, its manageable overheads and its steady flow of data make it one of the most analysable venues in British greyhound racing. The edge is there for anyone willing to do the work.